Metrics Don’t Inform Decisions — Interpretations Do
Organizations rarely struggle because they lack data. They struggle because they cannot agree on what the data means. Metrics do not inform decisions—they are interpreted, and those interpretations determine what organizations actually do.
Most organizations believe their decisions are grounded in data.
If the right metrics are in place, clarity should follow. Alignment should follow. The next move should be obvious.
But metrics do not create clarity.
They create signals — and those signals require interpretation before they mean anything at all.
In practice, what organizations call “data-driven decisions” are almost always interpretation-driven decisions.
I. Where Meaning Breaks
Organizations invest heavily in measurement.
Dashboards become more sophisticated. Reporting becomes more frequent. Definitions are standardized. Visibility improves.
The assumption is straightforward:
If everyone is looking at the same data, they should arrive at the same conclusions.
But they don’t.
Two leaders can look at the same metric and walk away with entirely different views of what’s happening — and what should happen next.
Not because one is right and the other is wrong.
Because the metric itself does not contain meaning.
Metrics do not inform decisions.
They are signals.
And signals do not resolve ambiguity — they expose it.
A metric can suggest progress, risk, or irrelevance depending on how it is read.
The number does not decide.
Meaning is assigned — often implicitly, often inconsistently, and rarely examined directly.
II. Where Interpretation Actually Happens
That interpretation does not happen in dashboards.
It happens around them.
In pre-reads. In conversations. In leadership discussions. In how a number is framed before it is ever questioned.
By the time a metric reaches a decision, it has already been translated.
What appears to be a shared view of data is often a collection of unspoken interpretations.
Those interpretations only become visible when decisions diverge.
III. Metric Meaning Drift
This is where distortion enters.
Metric Meaning Drift occurs when the interpretation of a metric changes as it moves across layers, contexts, or time.
The number remains stable.
The meaning does not.
At one level, a metric signals acceptable performance. At another, it signals emerging risk. At another, it is dismissed entirely.
None of these interpretations are inherently incorrect.
But they are rarely aligned.
And that misalignment is almost never visible in the dashboard itself.
As metrics move through an organization, they are continuously reframed.
Context is added. Context is removed. Emphasis shifts. Thresholds move.
A number that once signaled progress can, without changing, begin to signal concern.
A metric interpreted as a warning in one forum can be treated as reassurance in another.
Over time, meaning drifts.
Not dramatically, but enough.
Enough to change decisions without anyone noticing that meaning changed first.
IV. The Illusion of Alignment
This is often misdiagnosed.
Misalignment is attributed to communication gaps, lack of accountability, or unclear priorities.
But in many cases, the issue is simpler — and more structural:
The organization is not aligned on what the metric means.
V. Why More Data Makes It Worse
The typical response is to improve the data.
Add more metrics. Refine definitions. Increase reporting frequency. Build more comprehensive dashboards.
But more data does not resolve ambiguity.
It multiplies interpretation.
And without a shared way of assigning meaning, additional metrics do not create clarity.
They increase the surface area for divergence.
VI. What Metrics Reveal
This is why dashboards often feel both precise and insufficient at the same time.
They provide visibility.
But not agreement.
They show what is happening.
But not what it means.
VII. The Real Source of Divergence
If metrics actually informed decisions, alignment would be straightforward.
The same inputs would produce the same conclusions.
But that is not how organizations operate.
Meaning is constructed — unevenly, implicitly, and often invisibly.
And decisions follow that meaning.
Until interpretation is made visible, it remains a hidden source of divergence.
And until it is treated as part of the system — not a byproduct of it — organizations will continue to invest in better measurement while struggling to achieve consistent decisions.
Because metrics don’t create alignment.
They reveal how fragmented interpretation already is.
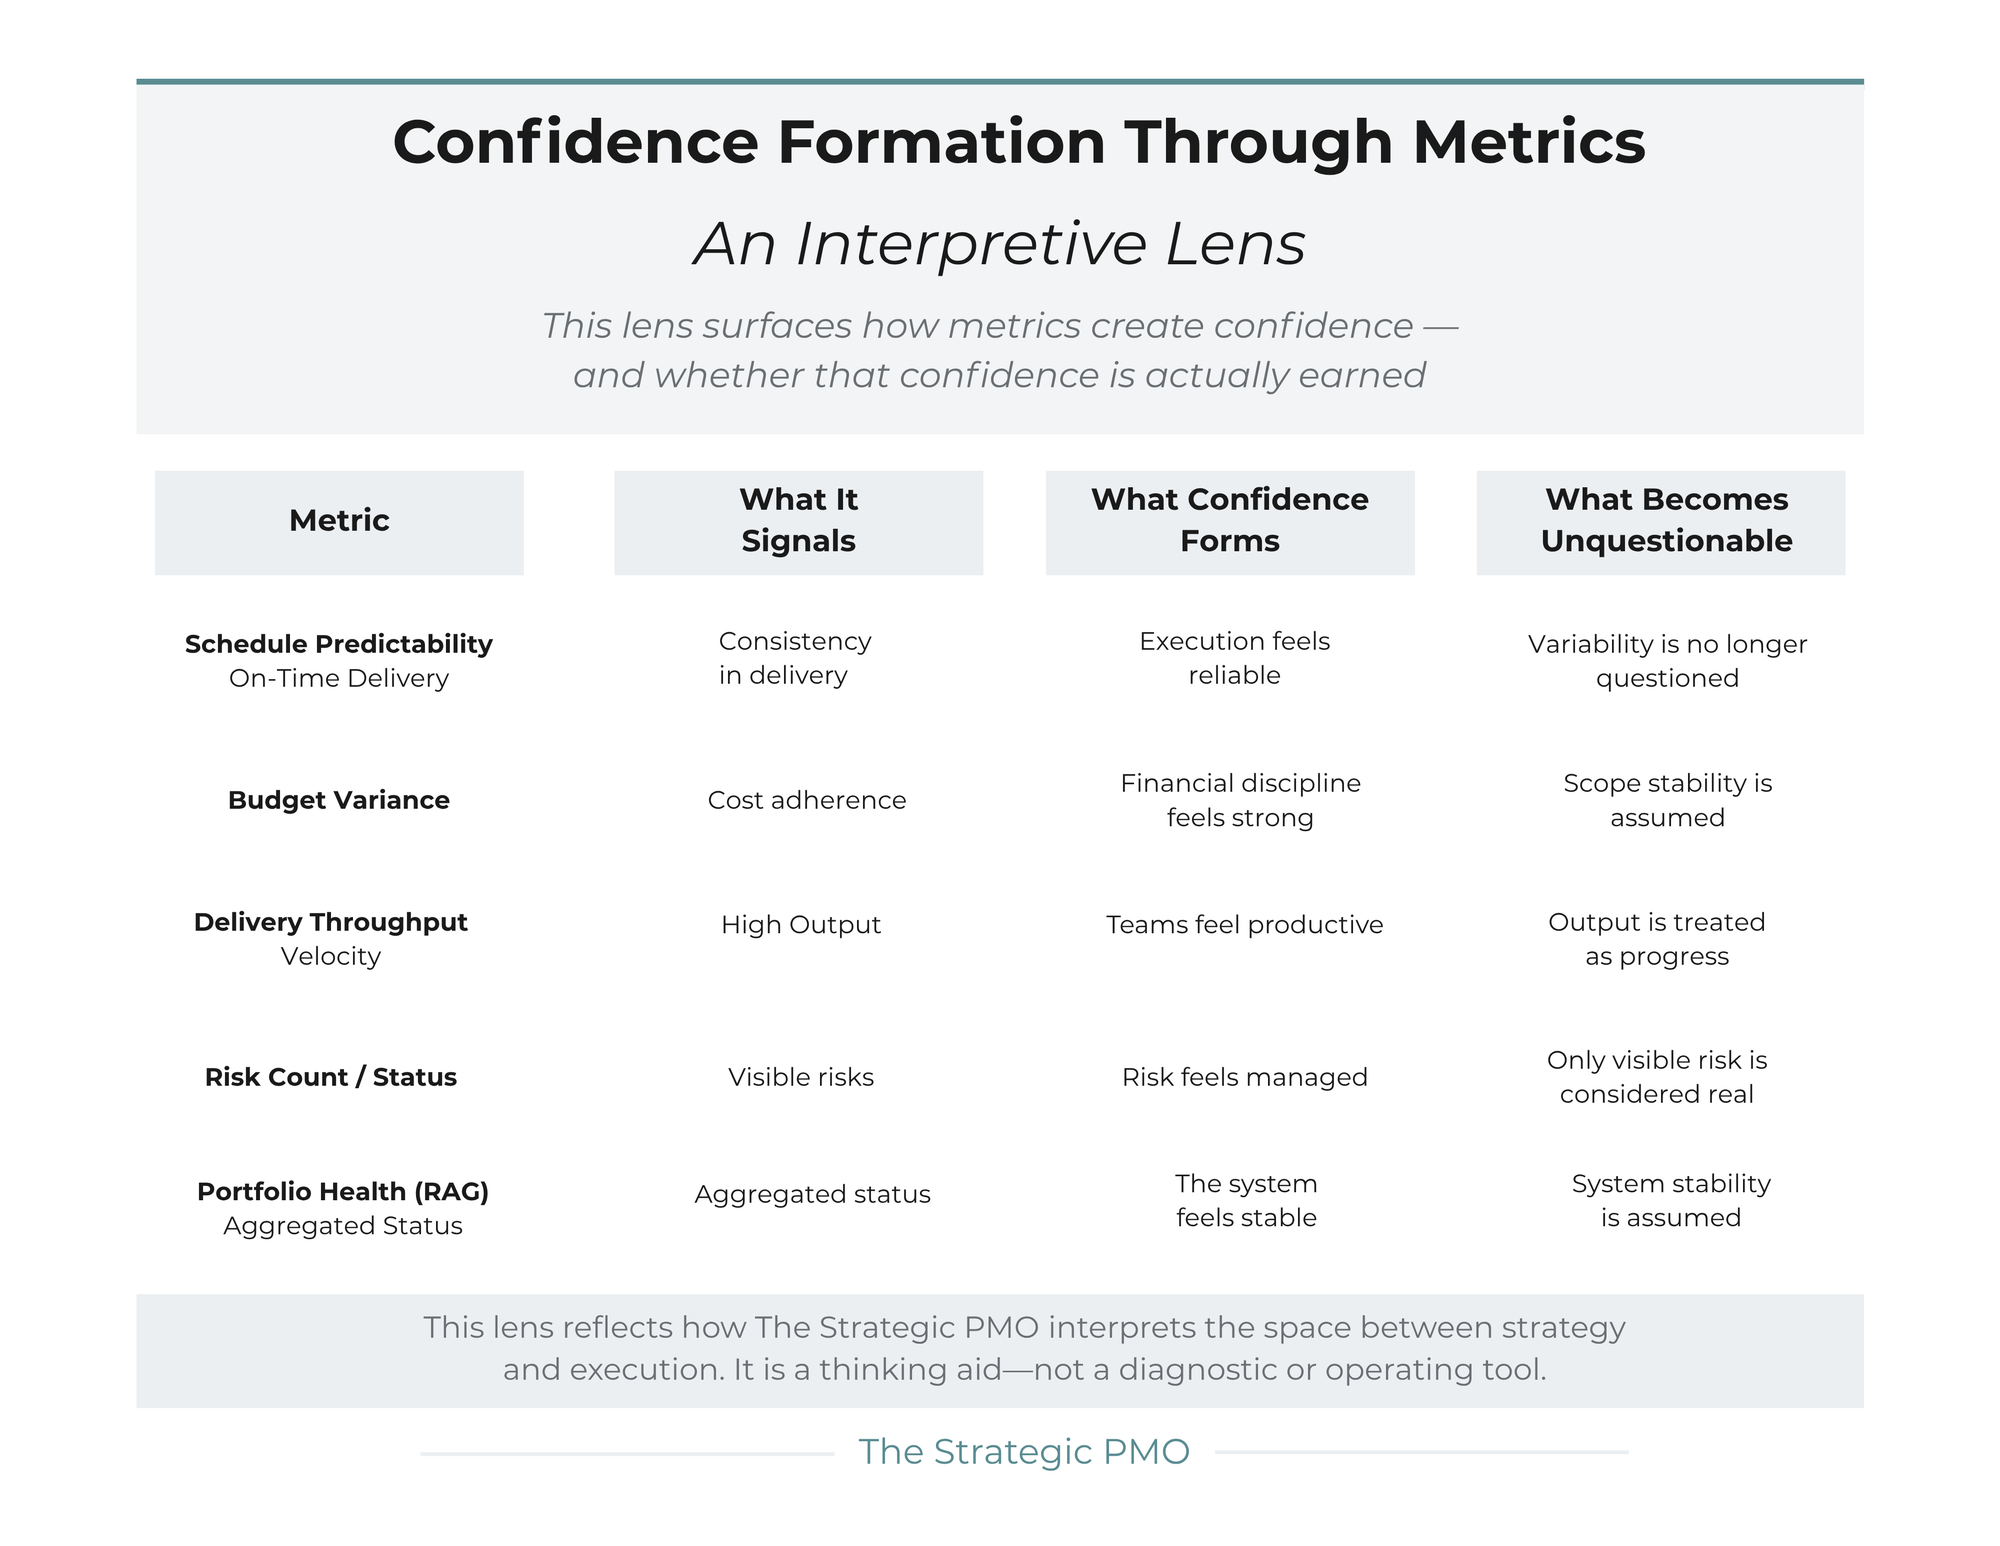
Below is an interpretive lens that surfaces how metrics create confidence—and whether that confidence is actually earned.